|
|
Sample screen shots
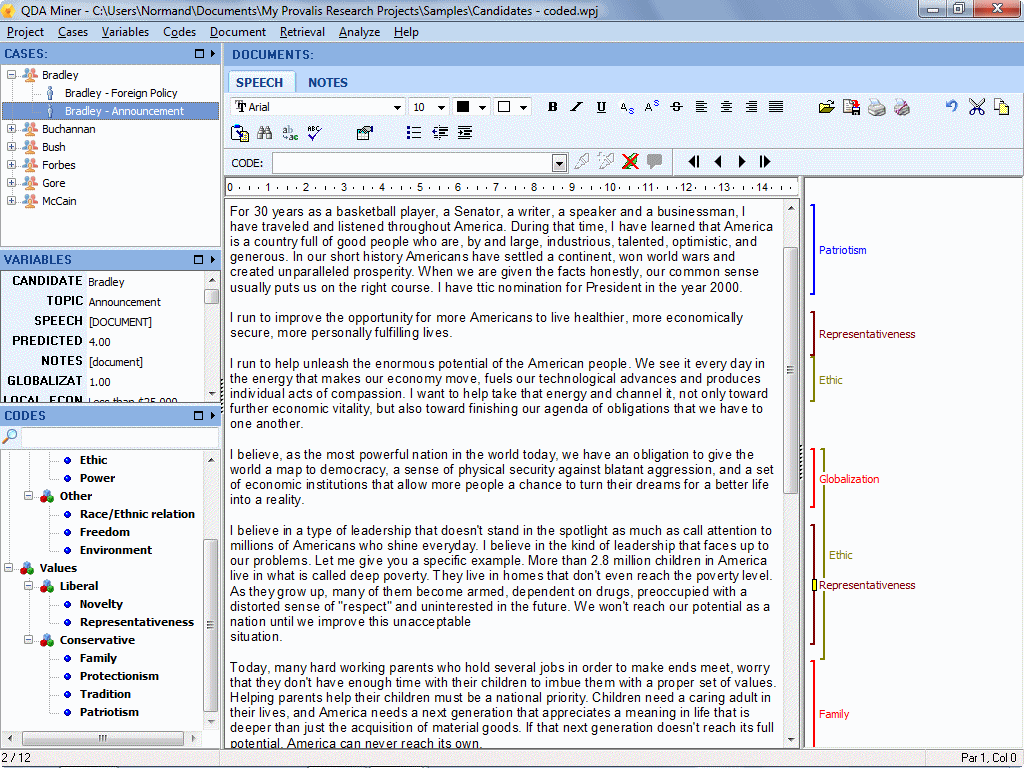 QDA Miner provides an intuitive environment for coding and annotating documents. |
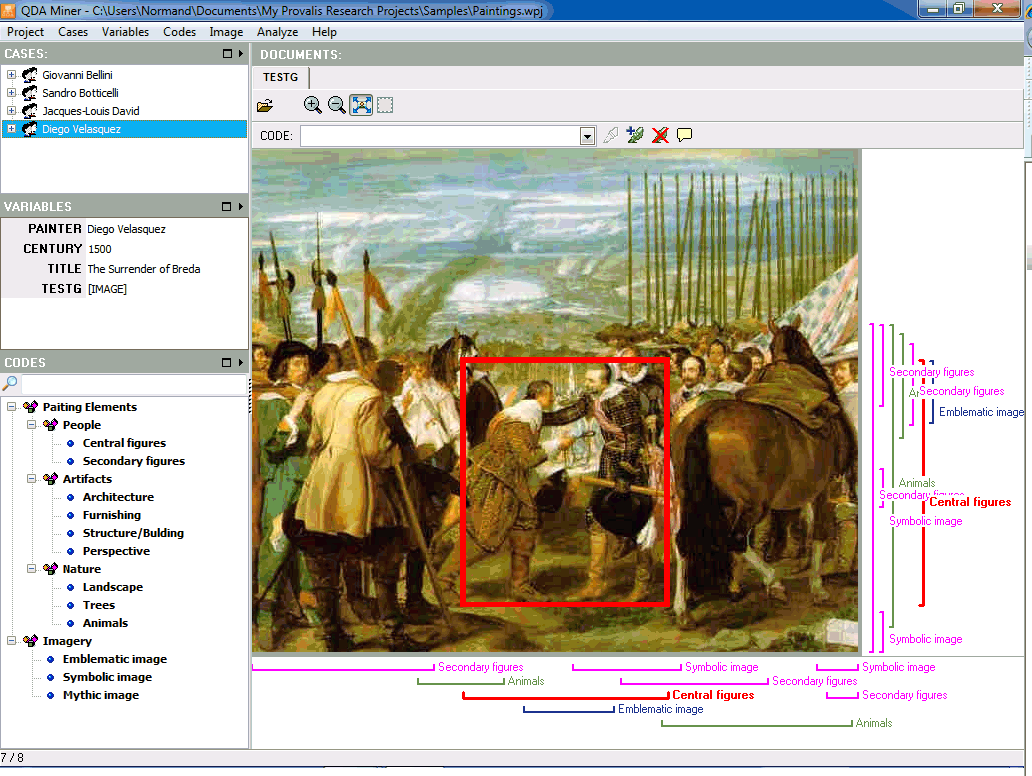 QDA Miner also supports the coding of images, allowing codes to be applied to different elements of the image. |
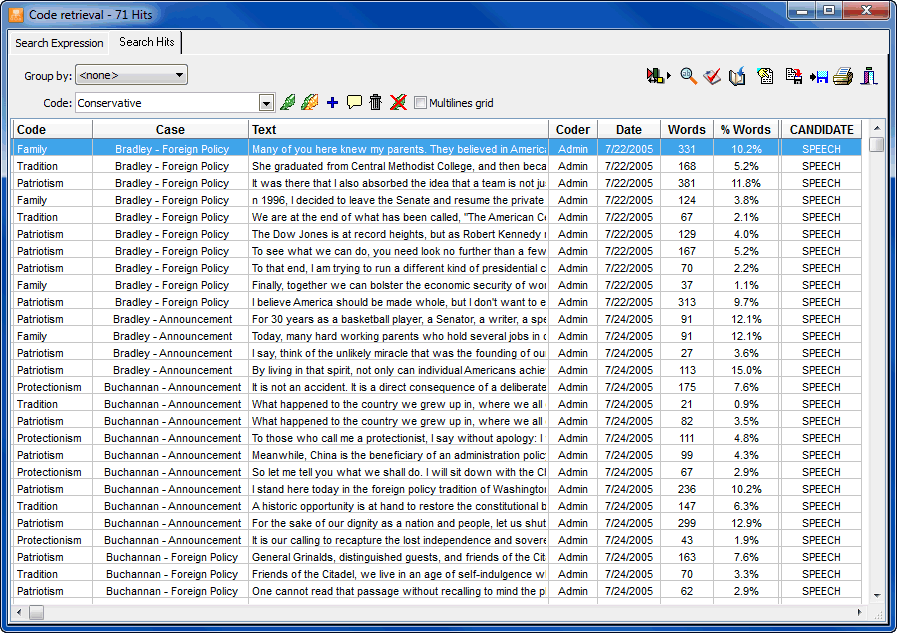 QDA Miner provides many text search and coding retrieval tools. |
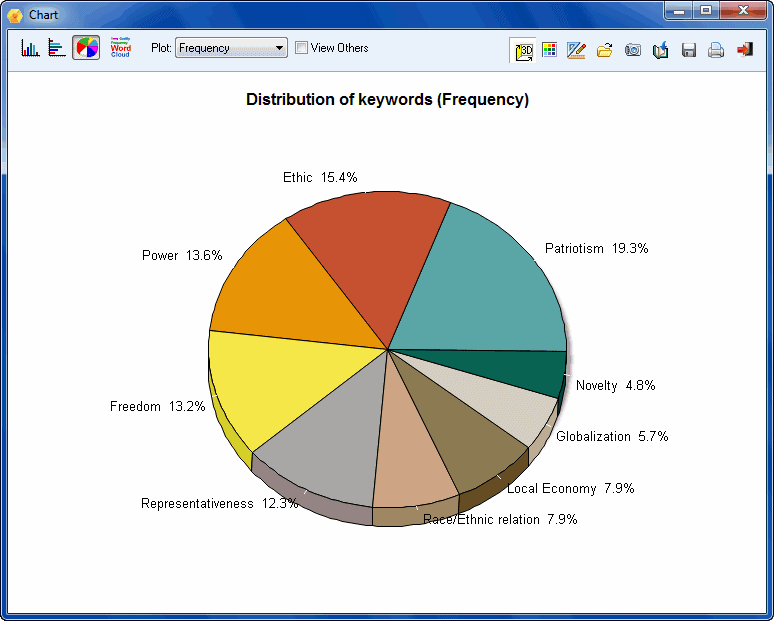 Presentation quality graphics such as pie charts and bar charts may be created to represent the frequency of codes. |
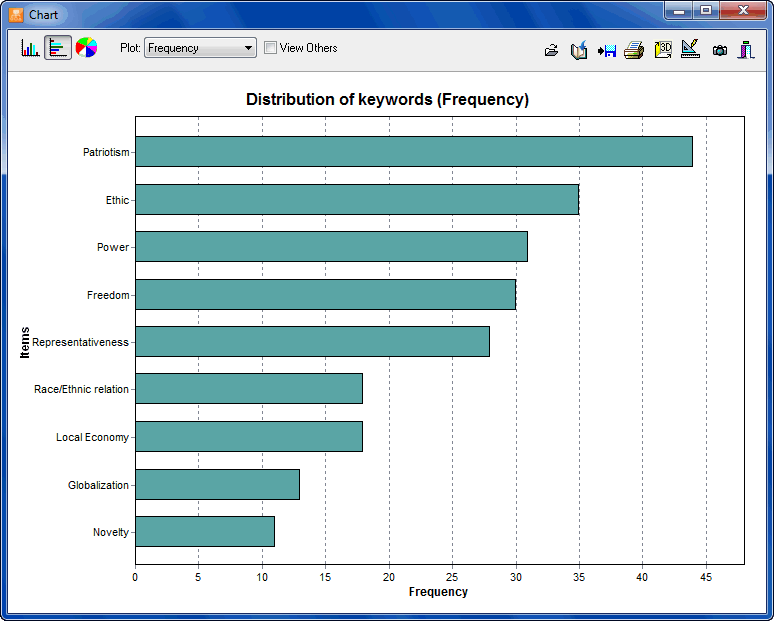 Bar charts may be plotted with the bars oriented vertically or horizontally |
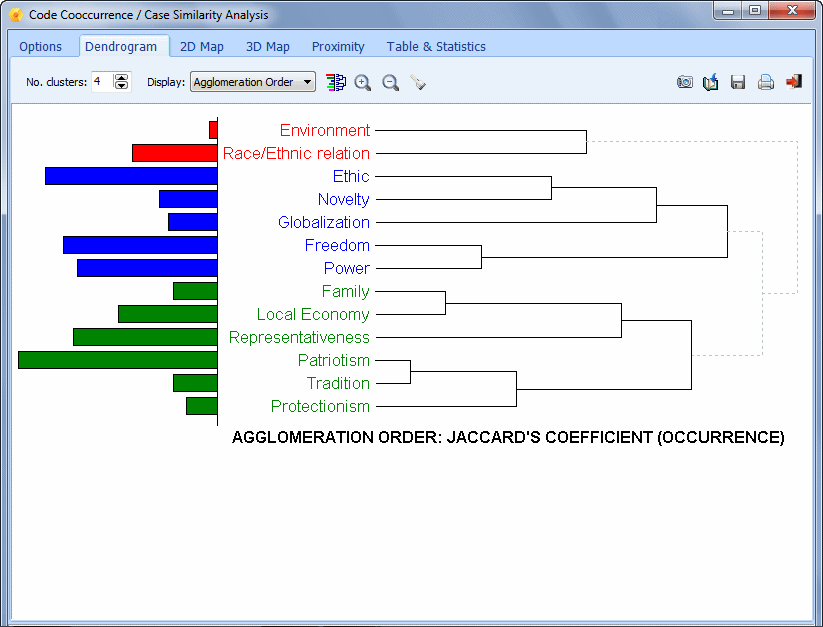 Hierarchical clustering is a useful exploratory tool to quickly identify the co-occurrences of codes or the similarity of case (based on coding patterns). |
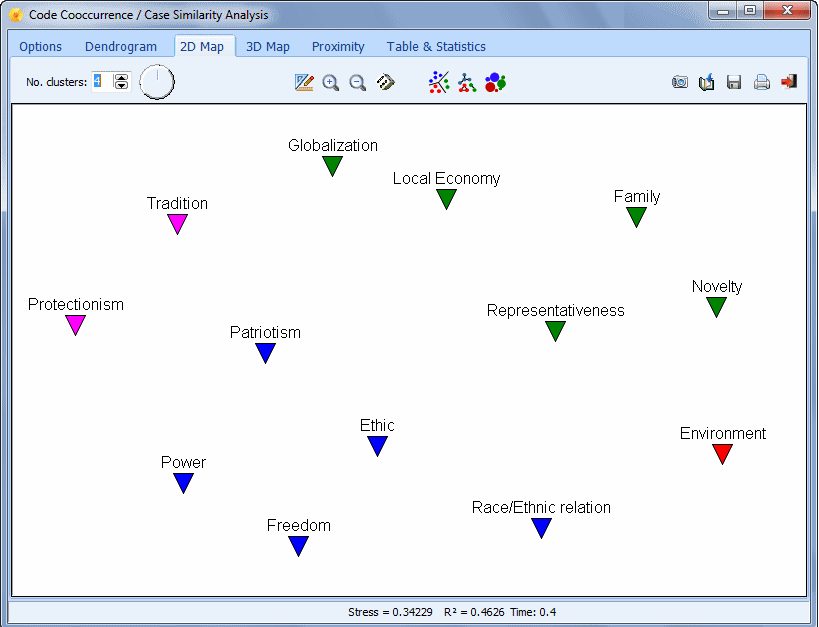 Multidimensional scaling maps may also be used to represent the proximity of codes or to find clusters of cases with similar coding patterns.. |
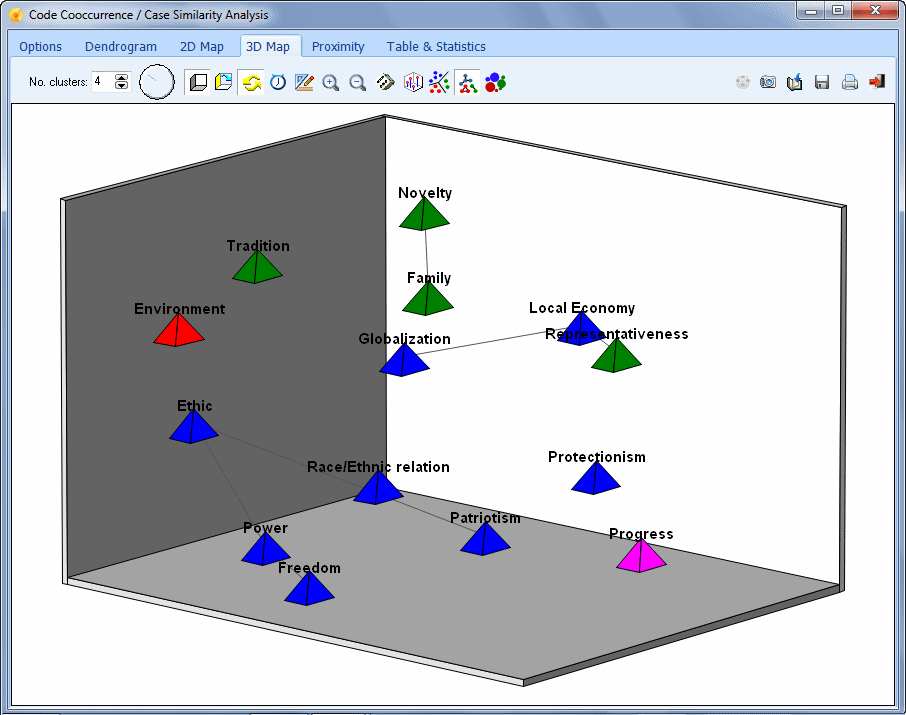 This 3D multidimensional scaling can displays lines to represent how strongly related are data points. |
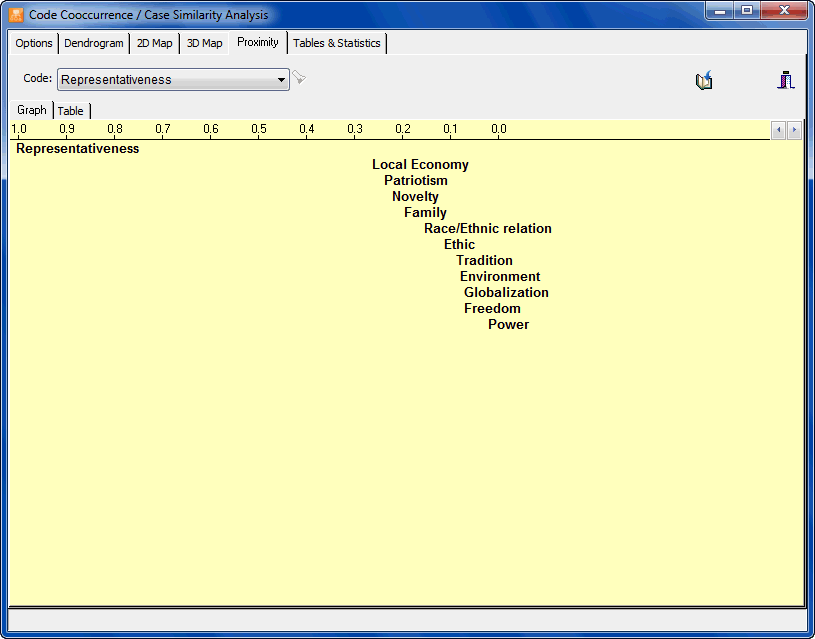 Proximity plots represent the distance of all codes to a specific one. It may also be used to represent the similarity of cases (based on the coding patterns). |
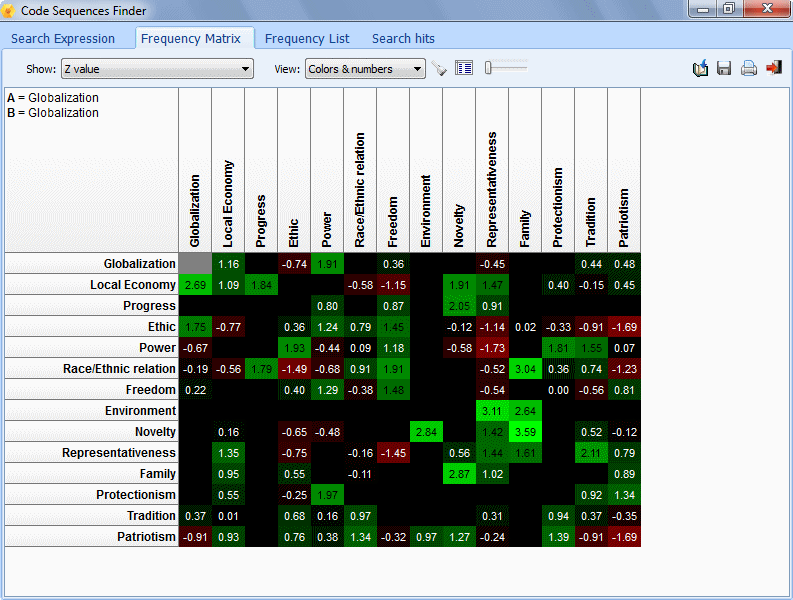 The Coding Sequences tool can be used to identify recurring sequences of codes. |
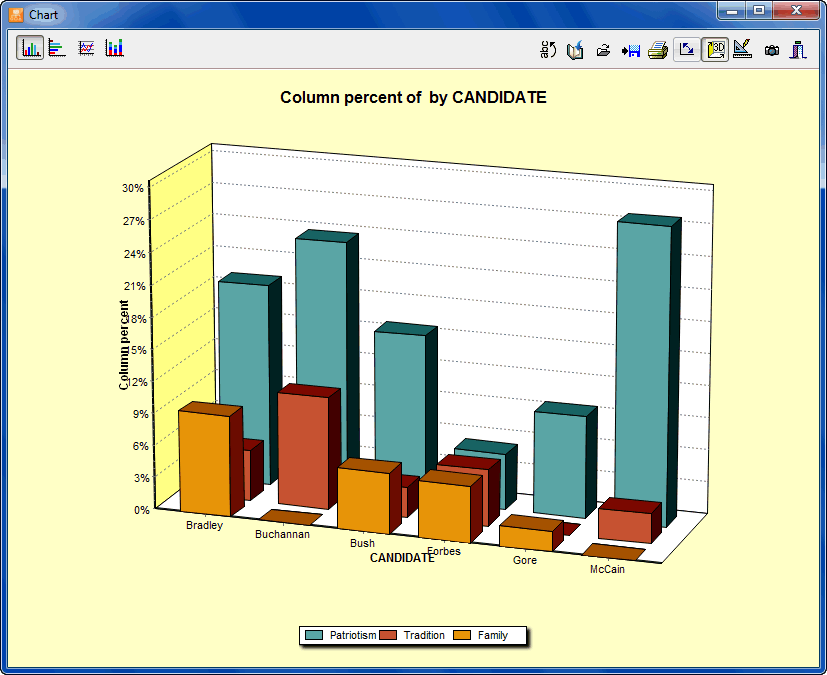 Bar charts may be used to represent the frequency of codes across values of a numerical or categorical variable. |
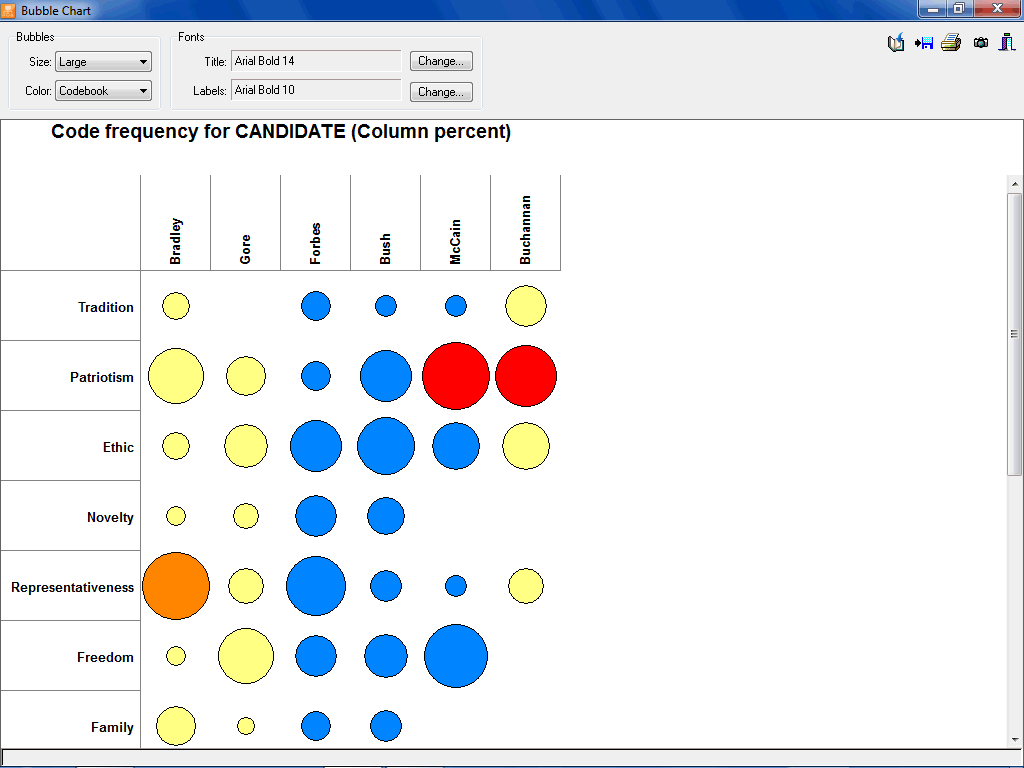 Bubble charts are graphic representations of contingency tables where relative frequencies are represented by circles of different diameters. |
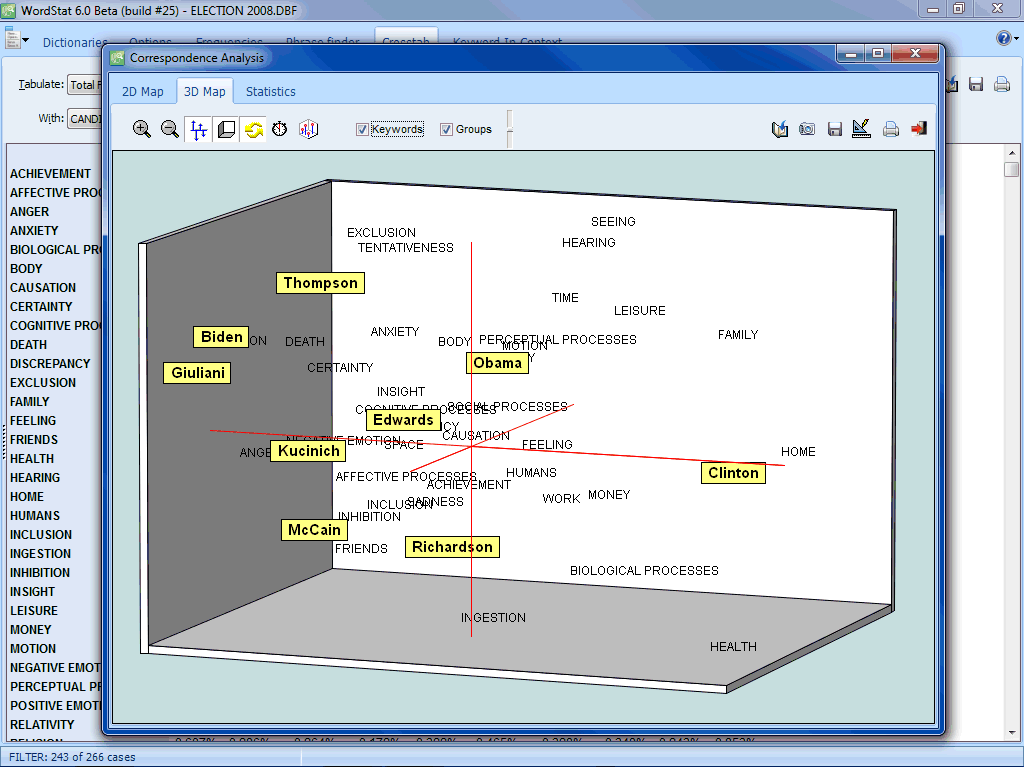 Correspondence analysis is a powerful exploratory technique to identify relationships between codes and values of a numerical or categorical variable. |
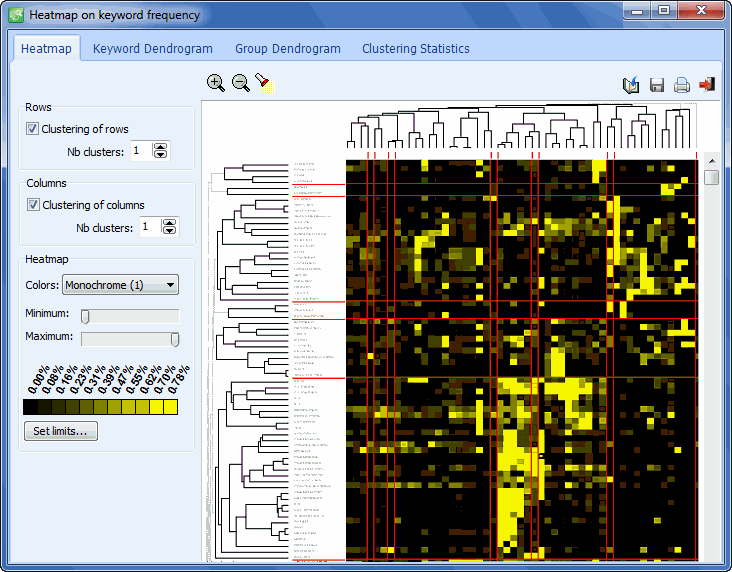 Heatmaps are especially useful to explore large cross frequency tables and identify distribution patterns. |